PREDICTIVE O&M & ASSET INTELLIGENCE
Solar Panel Soiling Detection & Loss Analytics for Utility Plants
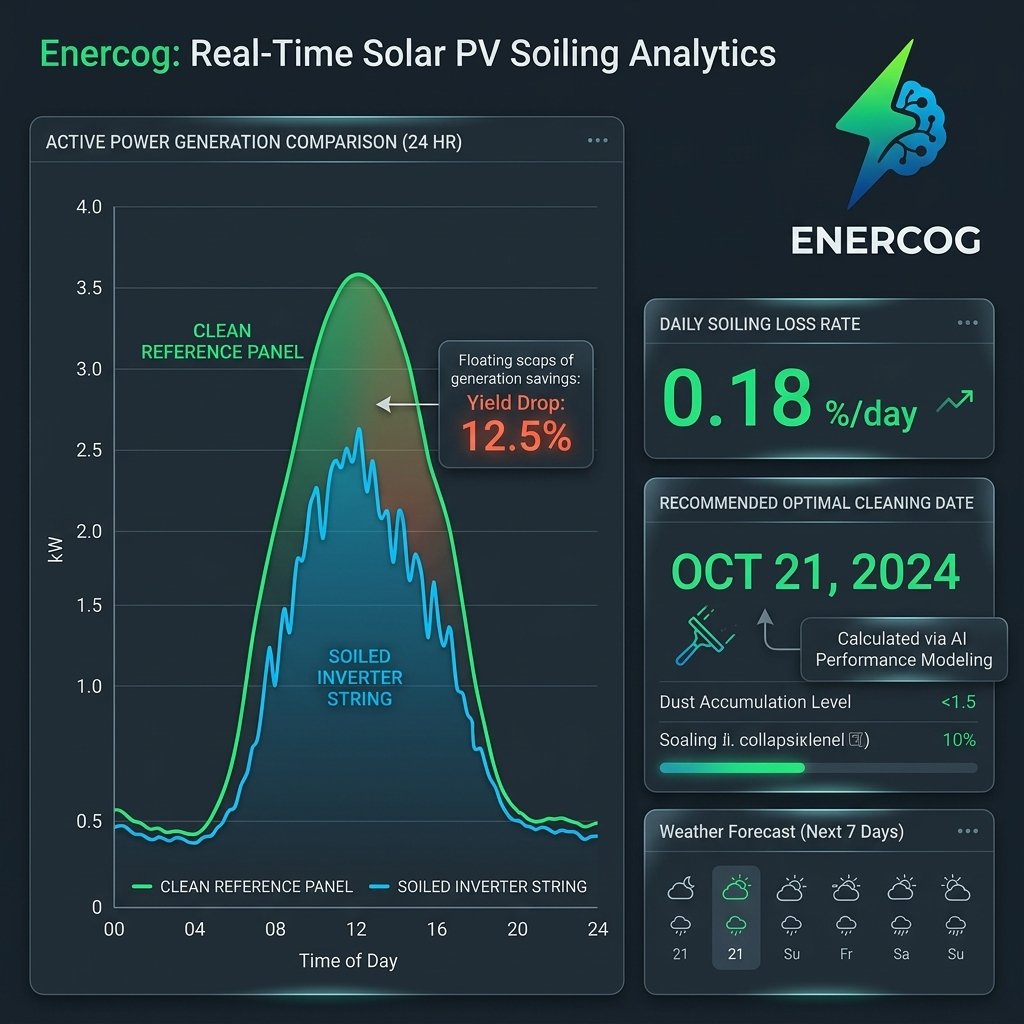
Solar panel soiling detection helps plant operators isolate dust losses and schedule module cleaning with precision. Enercog’s analytics platform processes standard on-site pyranometer data and string-level inverter feeds to map soiling ratios across each block—triggering cleaning alerts only when expected revenue recovery justifies the operational cost.
Powered by Cortex Cloud AI and Synapse Edge RTU, providing IEC 61724-1 compliant soiling analytics, block-level loss heatmaps, and data-driven wash scheduling.
Closed-Loop Soiling Detection & Wash Optimization Flow
Integrated empirical soiling analytics: On-site WMS pyranometer feeds and string-level inverter telemetry ingest into the Cortex Soiling Analytics Core, delivering granular soiling ratios (SR) to automate predictive wash dispatch and protect plant PPA revenues.
OPERATIONAL REALITIES & O&M RISK
The Hidden Cost of Soiling in Utility-Scale Solar Portfolios
Dust and airborne particulates reduce energy generation across solar assets. Traditional O&M practices often struggle to balance cleaning costs against actual generation recovery.
Invisible Losses in Portfolio Averages
Monthly plant-wide Performance Ratio (PR) averages often mask localized dust buildup. Clean sections can hide heavily soiled blocks along perimeter roads or agricultural borders, allowing yield losses to persist undetected across billing cycles.
- Non-uniform dust accumulation across large plant layouts
- Lack of block-by-block visibility in aggregate monthly reports
- Gradual daily soiling trends that evade standard SCADA alarms
Static Calendar Cleaning Risks
Fixed calendar-based wash cycles often lead to misallocated O&M budgets. Teams may wash arrays right after unexpected rain or leave heavily soiled arrays unwashed for weeks between scheduled cycles.
- High water hauling and procurement costs in arid regions
- Labor deployed without objective energy recovery justification
- Unnecessary panel surface wear from over-cleaning clean arrays
Isolating Soiling from Plant Health
When inverter output drops, standard monitoring systems cannot easily identify the root cause. Without dedicated analytics, operators risk confusing surface dust with thermal derating, string shading, or long-term hardware degradation.
- Distinguishing weather-related derating from surface dust
- Differentiating reversible soiling from permanent cell aging
- Ensuring cleaning crews are dispatched only when necessary
SYSTEM INTEGRATION WORKFLOW
End-to-End Soiling Loss Analytics & Wash Optimization Architecture
Enercog connects on-site weather monitoring stations and multi-brand inverter telemetry with the Cortex cloud analytics engine, calculating daily soiling ratios and automating cleaning dispatch recommendations.
Figure 2: Closed-Loop Soiling Analytics, Loss Attribution & O&M Dispatch Architecture. Ingests on-site Weather Monitoring Station (Synapse WMS) feeds (POA/GHI pyranometers, module temperature) and string-level inverter metrics, processes them in Cortex Cloud AI, and delivers granular soiling heatmaps and predictive wash triggers on Clarity UI.
ENGINEERING CAPABILITIES
6 Operational Pillars of Enercog Soiling Analytics
Purpose-built for utility solar farms, commercial portfolios, and asset managers seeking high-resolution loss visibility, disciplined OPEX control, and automated O&M workflows.
Multi-Block Plant Yield Mapping
Provides complete spatial visibility across large solar acreage. The platform continuously maps generation performance across individual inverter blocks, pinpointing localized dust buildup and perimeter ingress without requiring manual site walks.
- Interactive block-by-block soiling heatmaps on Clarity UI
- Early identification of high-dust zones along roads and agricultural borders
- Centralized overview for distributed commercial and utility portfolios
Intelligent Loss Attribution
Ensures cleaning alerts reflect genuine surface dust rather than weather anomalies or operational constraints. The platform automatically isolates soiling losses from everyday plant operating conditions, eliminating false alarms.
- Excludes peak inverter clipping and irradiance shifts from soiling indices
- Protects maintenance teams from dispatching cleanings during non-soiling events
- Maintains dependable historical data for plant performance audits
Automated Cleaning Dispatch Triggers
Transforms routine O&M from arbitrary calendar schedules into an automated, data-driven workflow. Operators receive direct dispatch recommendations when module cleaning will deliver immediate commercial recovery.
- Automated cleaning notifications prioritized by recoverable energy value
- Seamless integration into existing plant maintenance schedules and work orders
- Adaptable threshold settings tailored to site-specific power tariffs
OPEX & Resource Optimization
Reduces unnecessary operations and maintenance expenditure by targeting only the arrays that require attention. Conserves critical water resources and optimizes manpower deployment across arid and desert project locations.
- Eliminates premature washing of clean arrays following rainfall
- Significant reduction in water procurement, hauling, and labor costs
- Minimizes module surface wear caused by unnecessary mechanical cleaning
Zero Dedicated Hardware Sensor CAPEX
Deploys across operational brownfield plants and new greenfield projects without procuring, mounting, or wiring specialized optical soiling sensor stations or reference cell hardware.
- Operates using existing on-site weather stations and inverter communications
- Zero ongoing field maintenance, glass polishing, or sensor calibration overhead
- Rapid onboarding via Synapse Edge RTU or direct API connectivity
Contractor & Cleaning Quality Verification
Establishes complete accountability for module cleaning operations. The platform tracks generation recovery immediately following a wash cycle, verifying that cleaning contractors have met contractual performance benchmarks.
- Objective pre- and post-wash generation recovery verification
- Automated contractor performance reporting and SLA compliance auditing
- Supports manual washing, waterless tractor brushes, and robotic cleaning fleets
COMPREHENSIVE BENCHMARK
Comparing Soiling Detection Approaches for Solar Assets
Evaluate how software-driven empirical analytics compares with dedicated optical hardware stations and traditional calendar-based O&M routines across capital investment, coverage, and operational efficiency.
| Evaluation Dimension | Optical Soiling Stations (Hardware) | Static Calendar Cleaning (Traditional O&M) | Enercog Cortex Soiling Analytics (Software) |
|---|---|---|---|
| Capital Investment (CAPEX) | High initial cost per unit; multiple units required for large plant acreage. | Zero initial CAPEX; purely ongoing operational expense. | Zero dedicated sensor CAPEX; utilizes existing WMS pyranometers & inverters. |
| Spatial Resolution & Coverage | Point-source only; measures dust at a single physical sensor location. | Blanket plant-wide assumption; ignores localized perimeter dust gradients. | Block-by-block & string-level mapping; full plant spatial visibility. |
| Maintenance & Calibration | Requires regular manual glass cleaning and periodic sensor calibration. | Manual scheduling overhead; subjective visual inspection by field technicians. | Zero field sensor maintenance; continuous self-calibrating cloud pipeline. |
| Degradation & Loss Decoupling | Measures optical transmission only; blind to cell degradation or inverter clipping. | No loss attribution; assumes all generation variance is surface dust. | Complete loss decoupling; separates soiling, aging, and clipping. |
| Wash Dispatch Strategy | Manual interpretation required to translate optical opacity into cleaning ROI. | Fixed 15/30-day cycles; wastes water post-rain or delays washing post-dust storms. | Predictive closed-loop ROI trigger; washes when Yield Loss > Wash OPEX. |
HARDWARE TELEMETRY & WMS INTEGRATION
Modular Field Telemetry & Edge Gateway Specifications
Empirical soiling analytics operates by ingesting high-frequency on-site weather and inverter parameters. Enercog provides industrial edge controllers for seamless field sensor acquisition per Central Electricity Authority (CEA) technical standards.
| Deployment Tier | Hardware Form Factor & Architecture | Target Application Scope |
|---|---|---|
| Tier 1: Standard Industrial Edge Gateway (Synapse Series) | 35mm DIN-rail industrial controller, quad-core ARM Cortex processor, configurable 2 GB / 4 GB / 8 GB RAM tiers, 4x isolated RS-485/CAN interfaces, dual Gigabit Ethernet, wide operating temperature (-20°C to +70°C). | On-site Weather Monitoring Station (WMS) acquisition (Pyranometer POA/GHI, Modbus temperature sensors, anemometers), inverter SCADA telemetry, C&I open-access solar plants (<25 MW), and rooftop commercial solar portfolios. |
| Tier 2: Utility-Scale Server Deployment (Project-Engineered) | 1U/2U 19-inch rackmount industrial servers with 1+1 hot-standby automated failover (<500ms heartbeat), dual redundant hot-swappable AC/DC power supplies, ECC RAM, and local non-volatile historian storage. | Utility-scale solar power plants (>50 MW), wind-solar hybrid parks, pooling substations (PSS), and tenders enforcing mandatory 1+1 redundant Solar SCADA telemetry and historian retention per CEA guidelines. |
FREQUENTLY ASKED QUESTIONS
Frequently Asked Questions on Solar Panel Soiling Detection
Common technical, economic, and operational inquiries regarding empirical soiling calculation, sensor requirements, and predictive wash optimization.
How does solar panel soiling detection work without dedicated optical sensors?
Enercog’s solar panel soiling detection engine creates a baseline digital model of each inverter block using standard field telemetry. The system ingests Plane-of-Array (POA) and Global Horizontal Irradiance (GHI) from the on-site Weather Monitoring Station (WMS), along with string-level DC current and voltage from inverters.
By normalizing irradiance and module temperature according to IEC 61724-1 guidelines, the platform calculates expected clean generation and isolates the reduction caused by surface dust.
How does the platform distinguish soiling loss from permanent module degradation?
Soiling and module aging follow distinct physical patterns. Soiling builds up gradually over days or weeks and recovers immediately after a rain event or cleaning cycle.
Permanent degradation, such as Potential Induced Degradation (PID) or cell aging, causes irreversible long-term loss that does not recover post-cleaning. Cortex AI tracks pre- and post-cleaning baselines across operating seasons to decouple permanent aging from reversible dust accumulation.
What on-site sensors are mandatory for soiling loss analytics to function?
To deliver accurate soiling calculations, the system requires standard operational sensors: (1) A calibrated Class A pyranometer measuring Plane-of-Array (POA) irradiance, (2) Back-of-module temperature sensors, (3) Ambient temperature and wind speed feeds, and (4) Inverter SCADA telemetry (string current, voltage, and power).
Dedicated optical soiling sensors or reference PV cells are not required, avoiding extra hardware CAPEX and field cleaning maintenance.
How are cleaning recommendations determined?
The cleaning trigger is based on an economic model that evaluates lost generation revenue against the operational cost of cleaning.
When the value of recoverable solar energy exceeds the combined cost of water, labor, or equipment wear for a specific block, Clarity UI generates an automated cleaning recommendation.
Can soiling analytics be deployed on operational brownfield solar plants?
Yes. Because the solution is software-driven, operational solar plants with standard RS-485/Modbus inverter monitoring and an operational WMS can be onboarded seamlessly.
If a site requires edge communication hardware, Enercog can deploy the Synapse Edge RTU for multi-brand inverter interfacing, or ingest live telemetry feeds directly via secure API connectors.
Does the platform support single-axis tracker and bifacial module installations?
Yes. Cortex AI models account for dynamic module tilt on single-axis trackers by integrating real-time tracker angle feeds alongside POA irradiance.
For bifacial installations, the baseline model incorporates ground albedo and rear-side irradiance factors, ensuring accurate soiling determination across both front and rear surfaces.
Schedule a Soiling Loss Audit & Cleaning ROI Scoping for Your Plant
Connect with Enercog’s solar engineering team to assess dust loss patterns across your portfolio, benchmark cleaning OPEX, and scope an automated solar panel soiling detection solution.